 The Test Point Method for Sentences Like: $f(x) \gt g(x)$
In Precalculus, it's essential that you can easily and efficiently solve sentences like:
$$\frac{3x}{2}-1 \ge \frac 15 - 7x$$ and $$x^2 \ge 3$$
The first sentence is an example of a linear inequality in one variable; a prior lesson covers this type of sentence. For linear inequalities, the variable appears in the simplest possible way—all you have are numbers, times $\,x\,$ to the first power (i.e., terms of the form $\,kx\,,$ where $\,k\,$ is a real number).
The second sentence is an example of a nonlinear inequality in one variable. In nonlinear sentences, the variable appears in a more complicated way—perhaps you have an $\,x^2\,$ (or higher power), or $\,|x|\,,$ or $\,\sin x\,.$ For solving nonlinear inequalities, more advanced tools are needed, which are discussed in detail in this lesson and the next.
There are two basic methods for solving nonlinear inequalities in one variable. These two methods were introduced in a prior lesson, Solving Nonlinear Inequalities in One Variable (Introduction). Both are called ‘test point methods’, because they involve identifying important intervals, and then ‘testing’ a number from each of these intervals.
The two methods are:
-
The Test Point Method For Sentences Like ‘$f(x) \gt 0$’ (previous lesson)
(the One-Function Method; the ‘Compare With Zero’ Method)
-
The Test Point Method For Sentences Like ‘$f(x) \gt g(x)$’ (this lesson)
(the Two-Function Method; the ‘Truth’ Method)
There is a key idea before we get started:
For the ‘two-function’ test point method, it is necessary to understand the interaction between two graphs. We need to know where one of the graphs lies above (or below) the other graph.
As illustrated below, there are only two types of places where a graph can change from being (say) above another graph to below it—at an intersection point, or at a break in one of the graphs:
There are only two types of places where the graph of one function, $\,f\,,$ can go from above to below the graph of another function, $\,g\,$ (or vice versa):
| at an intersection point (where $\,f(x) = g(x)\,$) |
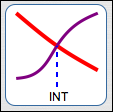
|
red is above purple to left of INT red is below purple to right of INT |
| where there's a break in the graph of $\,f\,$ or the graph of $\,g\,$ |

|
red is above purple to the left of the break red is below purple to the right of the break |
It's important to note that there doesn't have to be an above/below change at an intersection point, and there doesn't have to be an above/below change at a break. These are just the candidates for places where an above/below change can occur.
That is, the following implications are true:
- If two functions, $\,f\,$ and $\,g\,,$ have an above/below change at $\,c\,,$ then either $\,f(c) = g(c)\,$ or there is a break in the graph of $\,f\,$ or $\,g\,$ at $\,c\,.$
- If $\,f(c)\ne g(c)\,$ and there is no break in the graph of $\,f\,$ at $\,c\,$ and there is no break in the graph of $\,g\,$ at $\,c\,,$ then there is no above/below change in the graphs of $\,f\,$ and $\,g\,$ at $\,c\,.$

|
No above/below change at this intersection point No above/below change at this break |
The Test Point Method For Sentences Like $f(x) \ge g(x)$: Complete Solution With Full Discussion
In this first example, ‘$\,x^2 \ge 3\,$’ is solved using the ‘truth’ (or ‘two-function’) method. A full discussion accompanies this first solution. After, an in-a-nutshell version of the solution is given.
Define functions $\,f\,$ (the left-hand side) and $\,g\,$ (the right-hand side), so they can be easily referred to in later steps:
$$ \cssId{s47}{\overbrace{\strut \ \ x^2\ \ }^{f(x)}\ge \overbrace{\strut\ \ 3\ \ }^{g(x)}}$$ $$ \begin{align} &\cssId{s48}{\text{Define: } \ \ f(x) := x^2}\cr &\cssId{s49}{\text{Define: } \ \ g(x) := 3}\cr \end{align} $$Recall that ‘$\,:=\,$’ means ‘equal, by definition’. Since the inequality symbol is ‘$\,\ge\,$’, we need to find the values of $\,x\,$ for which the graph of $\,f\,$ lies on or above the graph of $\,g\,.$
Identify the candidates for above/below changes:
-
Places where $\,f(x) = g(x)\,$:
$$ \begin{gather} \cssId{s55}{x^2 = 3}\cr \cssId{s56}{x = \pm\sqrt 3} \end{gather} $$ - Breaks in the graph of $\,f\,$: there are none
- Breaks in the graph of $\,g\,$: there are none
Mark the candidates on a number line, using $\,i\,$ (for ‘intersection’) as the tick mark. In the diagram below, note the $\,i\,$ at $\,-\sqrt 3\,$ and the $\,i\,$ at $\,\sqrt 3\,.$
(If there were any breaks, they would be marked using ‘$\,B\,$’ as the tick mark.)
The number line itself should be labeled ‘Truth of $\,x^2 \ge 3\,$’, since you'll be marking the truth (True or False) of the inequality on each subinterval.
 Truth of $\,x^2\ge 3\,$
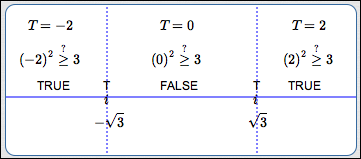
Choose a simple number (the ‘test point’) from each subinterval.
In this example, there are three subintervals: $(-\infty,-\sqrt 3)\,,$ $(-\sqrt 3,\sqrt 3)\,,$ and $(\sqrt 3,\infty)\,.$
Since $\,-\sqrt 3\approx -1.7\,,$ the number $-2$ is a good, simple choice from the first subinterval (notice the label ‘$\,T = -2\,$’ above).
The sentence ‘$\,x^2 \ge 3\,$’ is evaluated at $\,-2\,,$ and the result is true (notice the ‘$\,(-2)^2 \ge 3\,$’ above).
The question mark above the inequality symbol emphasizes that we're asking a question:
Is $\,(-2)^2\,$ greater than or equal to $\,3\,$?
Well, $\,4\,$ is greater than $\,3\,,$ so yes! Thus, ‘ TRUE ’ or ‘ T T T T T ’ signs are put on the first subinterval.
Notice that ‘ T ’ is put above each intersection point, since both ‘$\,(-\sqrt 3)^2 \ge 3\,$’ and ‘$\,(\sqrt 3)^2 \ge 3\,$’ are true.
Similarly, simple test points are chosen and the remaining subintervals are tested. A good rule of thumb—when zero is available as a test point, choose it! Most functions are very easy to evaluate at zero!
When the graphs of $\,f\,$ and $\,g\,$ are easy to obtain (as in this example), then you may not need to ‘officially’ use test points. Just graph $\,f(x) = x^2\,$ (in red below) and $\,g(x) = 3\,$ (in green below). The solutions of ‘$\,x^2 \ge 3\,$’ are the values of $\,x\,$ for which the graph of $\,f\,$ lies on or above the graph of $\,g\,.$
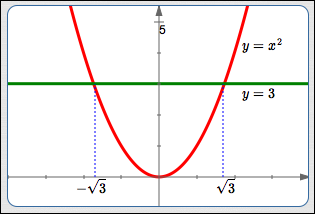
You can accompany the test point sketch with the graph above, and then use this graph to fill in the TRUE or FALSE on each subinterval, instead of actually choosing test points.
The test point sketch efficiently displays the truth (True or False) of ‘$\,x^2 \ge 3\,$’ everywhere. So, which values of $\,x\,$ do we want? The values of $\,x\,$ where the sentence is TRUE!
Using interval notation, the solution set is:
$$\cssId{s96}{(-\infty,-\sqrt 3\,] \cup [\,\sqrt 3,\infty)}$$Recall:
- Brackets $\,[\ ,\,]\,$ are used to indicate that an endpoint is included in the solution set.
- The union symbol $\,\cup\,$ (discussed in advanced set concepts) is used to put two sets together.
At first glance, this may seem like a lot of work. Usually, the hardest part is in determining the intersection points. The web exercise below will give you lots of practice to make you very efficient at the process!
Examples
The In-a-Nutshell Version of the Solution
Here is the ‘in-a-nutshell’ version of the previous solution. This is probably the minimum amount of work that a teacher would want you to show.
In the exercises in this section, you will be expected to show all of these steps. The comments are for your information, and do not need to be included in your solutions.
$x = \pm\sqrt 3$
(no breaks in either graph)
Truth of $\,x^2 \ge 3\,$
Mark intersection points and breaks on a number line, which is labeled ‘Truth of $\,x^2 \ge 3\,$’.
Mark intersection points with the tick mark $\,i\,.$
Using easy test points from each subinterval, check if $\,x^2 \ge 3\,$ is true or false, and mark accordingly.
Solution Set:
$(-\infty,-\sqrt 3\ ] \cup [\ \sqrt 3,\infty)$
Sentence Form of Solution:
$x\le -\sqrt 3\ \ \text{ or }\ \ x \ge\sqrt 3$
A Second Example, Involving Both a Break and an Intersection Point
Here is a second example, where there is both a break in one of the graphs, and an intersection point. Only the in-a-nutshell version of the solution is given.
$\displaystyle\frac 1x \lt 2$
Original Sentence
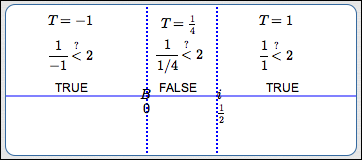
When $\,x = 0\,$ there is a break, since division by zero is not allowed. For $\,x\ne 0\,$:
$$ \begin{gather} \cssId{s138}{\frac 1x = 2}\cr\cr \cssId{s139}{x = \frac 12} \end{gather} $$(Take reciprocals of both sides: if two numbers are equal, so are their reciprocals.)
- where $\,f(x) = g(x)\,$
- breaks in the graph of $\,f\,$ or $\,g$
 Truth of $\frac 1x \lt 2$
Mark the candidates from the previous step on a number line which is labeled ‘Truth of $\,\frac 1x \lt 2\,$’.
Mark intersection points with the tick mark ‘$\,i\,$’.
Mark breaks with the tick mark ‘$\,B\,$’.
Test each subinterval to see if the sentence is true or false.
Solution Set:
$(-\infty,0) \cup (\frac 12,\infty)$
Sentence Form of Solution:
$x \lt 0\ \ \text{ or }\ \ x \gt \frac 12$
Using WolframAlpha to Solve Nonlinear Inequalities
Just for fun, jump up to wolframalpha.com and key in the two examples explored in this lesson:
x^2 >= 3
1/x < 2
Voila!
Concept Practice
For graphical insight into the solution set, a graph is sometimes displayed.
For example, the inequality ‘$\,x^2 \ge 3\,$’ is optionally accompanied by:
- Graph of $\,y = x^2\,$ (the left side of the inequality, green)
- Graph of $\,y = 3\,$ (the right side of the inequality, purple)
In this example, you are finding the values of $\,x\,$ where the green graph lies on or above the purple graph.
Click the ‘Show/Hide Graph’ button if you prefer not to see the graph.