 Solving Nonlinear Inequalities In One Variable (Introduction)
In Precalculus, it's essential that you can easily and efficiently solve sentences like:
$\,\frac{3x}{2}-1 \ge \frac 15 - 7x\,$
and
$\,x^2 \ge 3\,$
The first sentence is an example of a linear inequality in one variable; the prior lesson covers this type of sentence. For linear inequalities, the variable appears in the simplest possible way—all you have are numbers, times $\,x\,$ to the first power (i.e., terms of the form $\,kx\,,$ where $\,k\,$ is a real number).
The second sentence is an example of a nonlinear inequality in one variable, and is covered in this lesson and the next two. In nonlinear sentences, the variable appears in a more complicated way—perhaps you have an $\,x^2\,$ (or higher power), or $\,|x|\,,$ or $\,\sin x\,.$
For solving nonlinear inequalities, more advanced tools are needed.
To get started, review the essential concepts in these two lessons, being sure to click-click-click to practice the concepts from each:
- Graphical Interpretation of Sentences Like $f(x) = 0$ and $f(x) \gt 0$
- Graphical Interpretation of Sentences Like $f(x) = g(x)$ and $f(x) \ge g(x)$
Two Approaches For Solving Nonlinear Inequalities In One Variable
There are two basic methods for solving nonlinear inequalities in one variable. Both are called ‘test point methods’, because they involve identifying important intervals, and then ‘testing’ a number from each of these intervals.
Below, the sentence ‘$\,x^2 \ge 3\,$’ is solved using both methods, so you can get a sense of which appeals to you more. The solutions below are written extremely compactly—this is pretty much the bare minimum that a teacher would want to see. For all the underlying concepts and details, study the next two lessons:
- The Test Point Method For Sentences Like ‘$f(x) \gt 0\,$’ (the One-Function Method; the ‘Compare With Zero’ Method)
- The Test Point Method For Sentences Like ‘$f(x) \gt g(x)\,$’ (the Two-Function Method; the ‘Truth’ Method)
By the way, both methods work great. If you like working with just one function, thinking about where it is positive, negative, and zero, then you might prefer the first method. If you're fine working with two functions, thinking about where the graph of one lies on, above, or below the graph of the other, then you might prefer the second method.
Example: Solve $\,x^2 \ge 3\,$ Using the One-Function (Compare With Zero) Method
$x^2 \ge 3$
Original Sentence
Identify the candidates for sign changes for $\,f\,$:
- where $\,f(x)\,$ is zero
- breaks in the graph of $f$
 Sign of $\,f(x)\,$
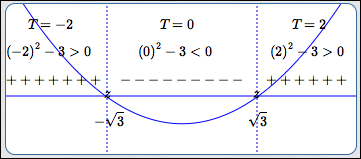
Mark the candidates from the previous step on a number line which is labeled ‘Sign of $\,f(x)\,$’.
Mark zeroes with the tick mark ‘$\,z\,$’.
Test each subinterval to see if $\,f(x)\,$ is $\,+\,$ or $\,-\,.$ Since $\,\sqrt 3\approx 1.7\,,$ test points $\,-2\,$ and $\,2\,$ are easy.
If the graph of $\,f\,$ is easy to obtain, then draw it in; in this case, you don't even need the test points! Graph above the $x$-axis? Then $\,f(x)\,$ is positive. Graph below the $x$-axis? Then $\,f(x)\,$ is negative. In this example, both the test points and graph are shown.
Solution Set:
$(-\infty,-\sqrt 3] \cup [\sqrt 3,\infty)$
Sentence Form of Solution:
$x\le -\sqrt 3\ \ \text{ or }\ \ x\ge \sqrt 3$
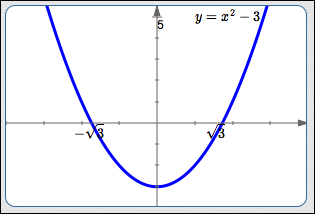
When a graph is easy to obtain (as in this example), then you may not need to ‘officially’ use the test point method.
Just graph $\,f(x) = x^2 - 3\,$ (see below): the solutions of ‘$\,x^2 - 3 \ge 0\,$’ are the values of $\,x\,$ for which the graph of $\,f\,$ lies on or above the $x$-axis.
Example: Solve $\,x^2 \ge 3\,$ Using the Two-Function (Truth) Method
$g(x) := 3$
 Truth of $\,x^2 \ge 3\,$
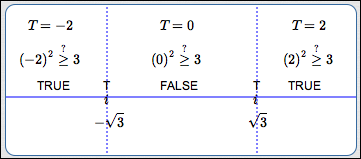
Mark intersection points and breaks on a number line, which is labeled ‘Truth of $\,x^2 \ge 3\,$’.
Mark intersection points with the tick mark $\,i\,.$
Using easy test points from each subinterval, check if ‘$\,x^2 \ge 3\,$’ is true or false, and mark accordingly.
Solution Set:
$(-\infty,-\sqrt 3] \cup [\sqrt 3,\infty)$
Sentence Form of Solution:
$x\le -\sqrt 3\ \ \text{ or }\ \ x \ge\sqrt 3$
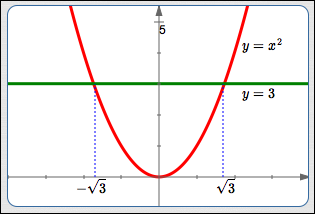
When graphs are easy to obtain (as in this example), then you may not need to ‘officially’ use the test point method.
Just graph $\,f(x) = x^2\,$ (in red below) and $\,g(x) = 3\,$ (in green below). Then, the solutions of ‘$\,x^2 \ge 3\,$’ are the values of $\,x\,$ for which the graph of $\,f\,$ lies on or above the graph of $\,g\,.$
Using WolframAlpha to Solve Nonlinear Inequalities
Just for fun, jump up to wolframalpha.com and key in:
x^2 >= 3
Voila!