 Graphing Tools: Reflections and the Absolute Value Transformation
Click here for a printable version of the discussion below.
You may want to review:
- Graphs of Functions
- Basic Models You Must Know
- Graphing Tools: Vertical and Horizontal Translations
- Graphing Tools: Vertical and Horizontal Scaling
There are things that you can DO to an equation of the form $\,y=f(x)\,$ that will change the graph in a variety of ways.
For example, you can move the graph up or down, left or right, reflect about the $\,x\,$ or $\,y\,$ axes, stretch or shrink vertically or horizontally.
An understanding of these transformations makes it easy to graph a wide variety of functions, by starting with a ‘basic model’ and then applying a sequence of transformations to change it to the desired function.
In this discussion, we will explore reflecting about the $x$-axis and the $y$-axis, and the absolute value transformation.
When you finish studying this lesson, you should be able to do a problem like this:
GRAPH: $\,y=-|\ln(-x)|\,$
-
Start with the graph of $\,y=\ln(x)\,.$ (This is the ‘basic model’.)
-
Replace every $\,x\,$ by $\,-x\,,$ giving the new equation $\,y = \ln(-x)\,.$ This reflects the graph about the $y$-axis.
-
Take the absolute value of the previous $y$-values, giving the new equation $\,y = |\ln(-x)|\,.$ This takes any part of the graph below the $x$-axis and reflects it about the $x$-axis. Any part of the graph on or above the $x$-axis remains the same.
-
Multiply the previous $y$-values by $\,-1\,,$ giving the new equation $\,y = -|\ln(-x)|\,.$ This reflects the graph about the $x$-axis.
Here are ideas that are needed to understand graphical transformations.
Ideas Regarding Functions and the Graph of a Function
-
A function is a rule: it takes an input, and gives a unique output.
-
If $\,x\,$ is the input to a function $\,f\,,$ then the unique output is called $\,f(x)\,$ (which is read as ‘$\,f\,$ of $\,x\,$’).
-
The graph of a function is a picture of all of its (input,output) pairs. We put the inputs along the horizontal axis (the $x$-axis), and the outputs along the vertical axis (the $y$-axis).
-
Thus, the graph of a function $\,f\,$ is a picture of all points of the form: $$\bigl(x, \overset{\text{$y$-value}}{\overbrace{ f(x)}} \bigr)$$
Here, $\,x\,$ is the input, and $\,f(x)\,$ is the corresponding output.
-
The equation $\,y=f(x)\,$ is an equation in two variables, $\,x\,$ and $\,y\,.$ A solution is a choice for $\,x\,$ and a choice for $\,y\,$ that makes the equation true. Of course, in order for this equation to be true, $\,y\,$ must equal $\,f(x)\,.$
Thus, solutions to the equation $\,y=f(x)\,$ are points of the form: $$\bigl(x, \overset{\text{$y$-value}}{\overbrace{ f(x)}} \bigr)$$
-
Compare the previous two ideas!
To ‘graph the function $\,f\,$’ means to show all points of the form $\,\bigl(x,f(x)\bigr)\,.$
To ‘graph the equation $\,y=f(x)\,$’ means to show all points of the form $\,\bigl(x,f(x)\bigr)\,.$
These two requests mean exactly the same thing!
Ideas Regarding Reflecting About the $x$-axis
-
Points on the graph of $\,y=f(x)\,$ are of the form $\,\bigl(x,f(x)\bigr)\,.$
Points on the graph of $\,y=-f(x)\,$ are of the form $\,\bigl(x,-f(x)\bigr)\,.$
Thus, the graph of $\,y=-f(x)\,$ is found by taking the graph of $\,y=f(x)\,,$ and multiplying the $y$-values by $\,-1\,.$ This reflects the graph about the $x$-axis.
-
Transformations involving $\,y\,$ work the way you would expect them to work—they are intuitive.
-
Here is the thought process you should use when you are given the graph of $\,y=f(x)\,$ and asked about the graph of $\,y=-f(x)\,$:
$$ \begin{align} \cssId{s40}{\text{original equation:}} &\quad \cssId{s41}{y=f(x)}\cr \cssId{s42}{\text{new equation:}} &\quad \cssId{s43}{y=-f(x)} \end{align} $$interpretation of new equation:
$$ \cssId{s45}{\overset{\text{the new $y$-values}}{\overbrace{ \strut\ \ y\ \ }}} \cssId{s46}{\overset{\text{are}}{\overbrace{ \strut\ \ =\ \ }}}\ \cssId{s47}{\overset{\text{-1 times}}{\overbrace{ \strut \ \ -\ \ }}}\ \cssId{s48}{\overset{\text{the previous $y$-values}}{\overbrace{ \strut\ \ f(x)\ \ }}} $$ -
In reflection about the $x$-axis, a point $\,(a,b)\,$ on the graph of $\,y=f(x)\,$ moves to a point $\,(a,-b)\,$ on the graph of $\,y=-f(x)\,.$
Ideas Regarding Reflecting About the $y$-Axis
-
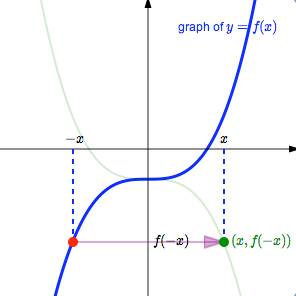
Points on the graph of $\,y=f(x)\,$ are of the form $\,\bigl(x,f(x)\bigr)\,.$
Points on the graph of $\,y=f(-x)\,$ are of the form $\,\bigl(x,f(-x)\bigr)\,.$
-
How can we locate these desired points $\,\bigl(x,f(-x)\bigr)\,$?
-
Pick a value of $\,x\,.$ First, go to the point $\,\bigl(-x\,,\,f(-x)\bigr)\,$ on the graph of $\,y=f(x)\,.$ This point has the $y$-value that we want, but it has the wrong $x$-value.
-
The $\,x$-value of this point is $\,-x\,,$ but the desired $x$-value is just $\,x\,.$ Thus, the current $x$-value must be multiplied by $\,-1\,$; that is, each $x$-value must be sent to its opposite. The $y$-value remains the same. This causes the point to reflect about the $y$-axis, and gives the desired point $\,\bigl(x,f(-x)\bigr)\,.$
Thus, the graph of $\,y=f(-x)\,$ is the same as the graph of $\,y=f(x)\,,$ except that it has been reflected about the $y$-axis.
-
Here is the thought process you should use when you are given the graph of $\,y=f(x)\,$ and asked about the graph of $\,y=f(-x)\,$:
$$ \begin{align} \cssId{s62}{\text{original equation:}} &\quad \cssId{s63}{y=f(x)}\cr \cssId{s64}{\text{new equation:}} &\quad \cssId{s65}{y=f(-x)} \end{align} $$interpretation of new equation:
$$ \cssId{s67}{y = f( \overset{\text{replace $x$ by $-x$}}{\overbrace{ \ \ -x\ \ }}} ) $$ Replacing every $\,x\,$ by $\,-x\,$ in an equation causes the graph to be reflected about the $y$-axis. -
In reflection about the $y$-axis, a point $\,(a,b)\,$ on the graph of $\,y=f(x)\,$ moves to a point $\,(-a,b)\,$ on the graph of $\,y=f(-x)\,.$
Ideas Regarding the Absolute Value Transformation
-
Points on the graph of $\,y=f(x)\,$ are of the form $\,\bigl(x,f(x)\bigr)\,.$
Points on the graph of $\,y=|f(x)|\,$ are of the form $\,\bigl(x,|f(x)|\bigr)\,.$
-
Thus, the graph of $\,y=|f(x)|\,$ is found by taking the graph of $\,y=f(x)\,$ and taking the absolute value of the $y$-values.
Points with positive $y$-values stay the same, since the absolute value of a positive number is itself. That is, points above the $x$-axis don't change.
Points with $\,y=0\,$ stay the same, since the absolute value of zero is itself. That is, points on the $x$-axis don't change.
Points with negative $y$-values will change, since taking the absolute value of a negative number makes it positive. That is, any point below the $x$-axis reflects about the $x$-axis.
These actions are summarized by saying that ‘any part of the graph below the $x$-axis flips up’.
-
Here is the thought process you should use when you are given the graph of $\,y=f(x)\,$ and asked about the graph of $\,y=|f(x)|\,$:
$$ \begin{align} \cssId{s82}{\text{original equation:}} &\quad \cssId{s83}{y=f(x)}\cr \cssId{s84}{\text{new equation:}} &\quad \cssId{s85}{y=|f(x)|} \end{align} $$interpretation of new equation:
$$ \cssId{s87}{\overset{\text{the new $y$-values}}{\overbrace{ \strut\ \ y\ \ }}} \cssId{s88}{\overset{\text{are}}{\overbrace{ \strut\ \ =\ \ }}} \cssId{s89}{\overset{\text{the absolute value of the previous $y$-values}}{\overbrace{ \strut\ \ |f(x)|\ \ }}} $$ -
In the absolute value transformation, a point $\,(a,b)\,$ on the graph of $\,y=f(x)\,$ moves to a point $\,(a,|b|)\,$ on the graph of $\,y=|f(x)|\,.$
Summary
Reflecting about the $x$-axis:
going from $\,y = f(x)\,$ to $\,y = -f(x)$
Reflecting about the $y$-axis:
going from $\,y = f(x)\,$ to $\,y = f(-x)$
Absolute Value Transformation:
going from $\,y = f(x)\,$ to $\,y = |f(x)|$
Any part of the graph on or above the
$x$-axis
stays the same;
any part of the graph below the
$x$-axis flips up.
Make Sure You See the Difference!
Make sure you see the difference between $\,y = -f(x)\,$ and $\,y = f(-x)\,$!
In the case of $\,y = -f(x)\,,$ the minus sign is ‘on the outside’; we're dropping $\,x\,$ in the $\,f\,$ box, getting the corresponding output, and then multiplying by $\,-1\,.$ This is reflection about the $x$-axis.
In the case of $\,y = f(-x)\,,$ the minus sign is ‘on the inside’; we're multiplying $\,x\,$ by $\,-1\,$ before dropping it into the $\,f\,$ box. This is reflection about the $y$-axis.