audio read-through Basic Models You Must Know

Need some basic information on graphs of functions first?  Graphs of Functions

There are a handful of functions that you need to have on your fingertips, in the following sense:

The purpose of this section is to give you practice with these basic models, which will be used freely throughout the rest of the course. (A few more ‘basic models’ will be added in future lessons.)

Here are the seven ‘basic models’ to be studied in this lesson. Each is shown in the same window, from $\,-5\,$ to $\,5\,$ on the $x$-axis, and from $\,-4\,$ to $\,4\,$ on the $y$-axis.

The scales on the $x$-axis and $y$-axis are identical. That is, a distance of $\,1\,$ on the $x$-axis is the same as a distance of $\,1\,$ on the $y$-axis.

Reading Domain and Range from a Graph

You may want to review Domain and Range of a Function from the Algebra I curriculum. Key concepts are repeated here for your convenience.

The domain of a function is the set of all its allowable inputs. The domain convention states that if the domain of a function is not specified, then it is assumed to be the set of all real numbers for which the function is defined. The domain of a function $\,f\,$ is denoted by $\,\text{dom}(f)\,.$

The range of a function is the set of all its outputs, as the inputs vary through the entire domain. The range of a function $\,f\,$ is denoted by $\,\text{ran}(f)\,.$

Since the domain and range are sets, correct set notation must be used when reporting them; it may be helpful to review interval and list notation.

Remember that the symbol $\,\mathbb{R}\,$ denotes the set of real numbers.

The domain of a function is usually easy to determine from a formula for the function:

However, the range of a function is usually more difficult to determine from a formula.

It is easy to get both the domain and range of a function from its graph, as discussed next.

Finding the Domain of a Function from its Graph

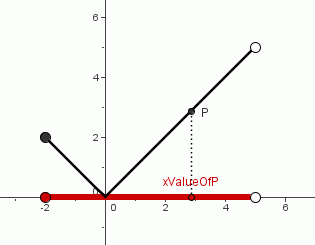
Consider the graph shown below: this is the absolute value function, with a restricted domain.
the absolute value function

As always, a typical point on the graph is an (input,output) pair; the $\,x$-value of the point is the input, and the $\,y$-value of the point is the output.

As the point $\,P\,$ is moved through the entire graph, all the $\,x$-values indicated in red are taken on. These are the allowable inputs for this function. Therefore, the domain of this function is the interval $\,[-2,5)\,.$

Notice that $\,-2\,$ is in the domain of the function, indicated by the opening ‘$\,[\,$’ in interval notation. However, $\,5\,$ is not in the domain of the function, indicated by the closing ‘$\,)\,$’ in interval notation.

To find the domain of a function from its graph, just ‘collapse’ each point, in its own ‘vertical channel’, into the $\,x\,$-axis.

Finding the Range of a Function from its Graph

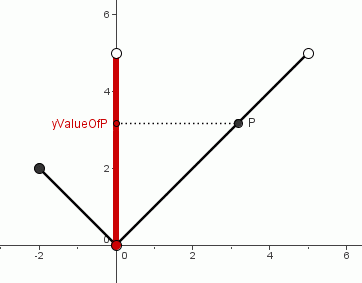
Now consider the same graph again, but this time focusing attention on the outputs, which are the $\,y$-values of the points.
the absolute value function

As the point $\,P\,$ is moved through the entire graph, all the $\,y$-values indicated in red are taken on. These are the outputs for this function, as the inputs vary through the entire domain. Therefore, the range of this function is the interval $\,[0,5)\,.$

Notice that $\,0\,$ is in the range of the function, indicated by the opening ‘$\,[\,$’ in interval notation. However, $\,5\,$ is not in the range of the function, indicated by the closing ‘$\,)\,$’ in interval notation.

To find the range of a function from its graph, just ‘collapse’ each point, in its own ‘horizontal channel’, into the $\,y\,$-axis.
Read-Through, Part 2

Details on Each of the Basic Models

Each function is now discussed in detail, indicating important properties that you must know. Read the discussion of the identity function carefully; it introduces notation that is not repeated for the subsequent basic models.

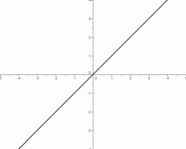
The Identity Function, $f(x)=x$

the identity function

End Behavior of the Graph

as $\,x \rightarrow \infty\,,$ $\,y\rightarrow\infty$

Read this aloud as: as $\,x\,$ goes to infinity, $\,y\,$ goes to infinity. This is the right-hand end behavior: as we move farther and farther to the right on the graph, the $\,y$-values of the points are increasing, without bound.

as $\,x\rightarrow -\infty\,,$ $\,y\rightarrow -\infty$

Read this aloud as: as $\,x\,$ goes to negative infinity, $\,y\,$ goes to negative infinity. This is the left-hand end behavior: as we move farther and farther to the left on the graph, the $\,y\,$-values of the points are decreasing, without bound.

There is a convention regarding graphs that you must know. If no endpoints are clearly indicated on the graph (using solid or hollow dots, as in the domain/range discussion above), then the behavior exhibited at the boundaries of the graph is assumed to continue forever and ever.

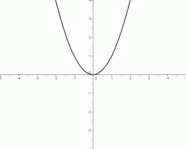
The Squaring Function, $\,f(x)=x^2$

the squaring function

End Behavior of the Graph

Right-hand end behavior:
as $\,x \rightarrow \infty\,,$ $\,y\rightarrow\infty$

Left-hand end behavior:
as $\,x\rightarrow -\infty\,,$ $\,y\rightarrow \infty$

Important Feature of the Graph

There is a horizontal tangent line at the point $\,(0,0)\,.$ That is, if you imagine yourself walking along the graph, going from left to right, then at the instant you are passing through the point $\,(0,0)\,,$ you will be traveling horizontally.

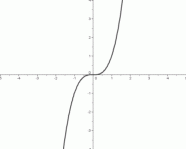
The Cubing Function, $\,f(x)=x^3$

the cubing function

End Behavior of the Graph

Right-hand end behavior:
as $\,x \rightarrow \infty\,,$ $\,y\rightarrow\infty$

Left-hand end behavior:
as $\,x\rightarrow -\infty\,,$ $\,y\rightarrow -\infty$

Important Feature of the Graph

There is a horizontal tangent line at the point $\,(0,0)\,.$ That is, if you imagine yourself walking along the graph, going from left to right, then at the instant you are passing through the point $\,(0,0)\,,$ you will be traveling horizontally.

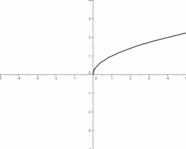
The Square Root Function, $\,f(x)=\sqrt{x}$

the square root function

End Behavior of the Graph

Right-hand end behavior:
as $\,x \rightarrow \infty\,,$ $\,y\rightarrow\infty$

Important Feature of the Graph

There is a vertical tangent line at the point $\,(0,0)\,.$ That is, if you imagine yourself walking along the graph, going from left to right, then at the instant you start off at the point $\,(0,0)\,,$ you will be traveling vertically.

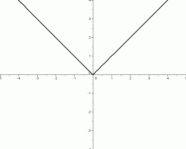
The Absolute Value Function, $\,f(x)=|x|$

the absolute value function

End Behavior of the Graph

Right-hand end behavior:
as $\,x \rightarrow \infty\,,$ $\,y\rightarrow\infty$

Left-hand end behavior:
as $\,x \rightarrow -\infty\,,$ $\,y\rightarrow\infty$

Important Feature of the Graph

There is a ‘kink’ (i.e., a sharp change in direction) at the point $\,(0,0)\,.$ That is, if you imagine yourself walking along the graph, going from left to right, then at the instant you are passing through the point $\,(0,0)\,,$ you will abruptly change direction.

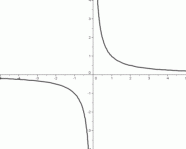
The Reciprocal Function, $\,\displaystyle f(x)=\frac{1}{x}$

the reciprocal function

End Behavior of the Graph

Right-hand end behavior:
as $\,x \rightarrow \infty\,,$ $\,y\rightarrow 0$

Left-hand end behavior:
as $\,x \rightarrow -\infty\,,$ $\,y\rightarrow 0$

Behavior Near Zero

Right-hand behavior near zero:
as $\,x \rightarrow 0^{+}\,,$ $y\rightarrow\infty$

The sentence ‘$\ x\rightarrow 0^{+}\ $’ is read aloud as:

$\,x\,$ approaches zero from the right-hand side

This means that the inputs are getting arbitrarily close to zero, coming in from the positive ($\,+\,$) side.

Left-hand behavior near zero:
as $\,x \rightarrow 0^{-}\,,$ $y\rightarrow -\infty$

The sentence ‘$\ x\rightarrow 0^{-}\ $’ is read aloud as:

$\,x\,$ approaches zero from the left-hand side

This means that the inputs are getting arbitrarily close to zero, coming in from the negative ($\,-\,$) side.

Constant Functions, $\,f(x)=k\,,$ for $\,k\in\mathbb{R}$

a constant function

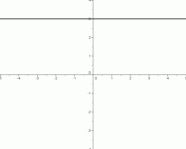
The graph shows the constant function $\,f(x)=3\,.$

Important Feature of the Graph

Every constant function graphs as a horizontal line.

Concept Practice