(This page is Part 2. Click here for Part 1.)
The Test Point Method for Graphing Linear Inequalities in Two Variables
So, what about graphing something like $\,2x - y \lt 3\,,$ which isn’t in slope-intercept form? You can (if desired) solve for $\,y\,,$ and then use the method above [in Part I]: $$\begin{gather} \cssId{s3}{2x - y \lt 3}\cr \cssId{s4}{-y \lt -2x + 3}\cr \cssId{s5}{y \gt 2x - 3} \end{gather} $$ (Remember to change the direction of the inequality symbol when you multiply/divide by a negative number.)
The graph of $\,2x - y \lt 3\,$ is the same as the graph of $\,y \gt 2x - 3\,.$ Graph the line $\,y = 2x - 3\,$ (dashed), and then shade everything above (see below). However, there’s an easier way. Keep reading!
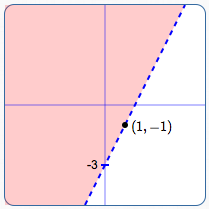 Graph of $\,2x - y \lt 3\,$
(which is equivalent to
$\,y > 2x - 3\,$)
The ‘Test Point Method’ is so-called because it involves choosing a ‘test point’ to decide which side of the line to shade. The process is illustrated with an example: graphing $\,2x - y \lt 3\,.$ The Test Point Method is usually easiest to use with sentences that aren't in slope-intercept form.
Graph, Using the Test Point Method: $\,2x - y \lt 3$
Step $1$: Identification
Recognize that ‘$\,2x - y \lt 3\,$’ is a linear inequality in two variables. Therefore, you know the graph is a half-plane. You need the boundary line; you need to know which side to shade.
Step $2$: Boundary Line
Graph the boundary line $\,2x - y = 3\,$ using the intercept method:
- when $\,x = 0\,,$ $\,y = -3\,$
- when $\,y = 0\,,$ $\,x = \frac{3}{2}\,$
Since the verb in ‘$\,2x - y \lt 3\,$’ is ‘$\,<\,$’, this line is not included in the solution set. Therefore, the line is dashed.
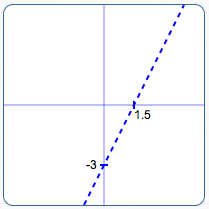 Graph the boundary line
using the intercept method
Step $3$: Test Point to Decide Which Side to Shade
Choose a simple point that is not on the line. Whenever $\,(0,0)\,$ is available, choose it! Zeroes are very easy to work with.
Is $\,(0,0)\,$ in the solution set? Substitute $\,x = 0\,$ and $\,y = 0\,$ into the original sentence ($\,2x - y \lt 3\,$), to see if it is true or false. Put a question mark over the inequality symbol, since you’re asking a question:
$$ \cssId{s37}{2(0) - 0 \overset{?}{\lt} 3} $$If the result is true, shade the side containing the test point. If the result is false, shade the other side.
Since ‘$\,0 < 3\,$’ is true, shade the side containing $\,(0,0)\,.$ Done!
With so many zeroes involved in this method, computations can often be done in your head, making this quick and easy!
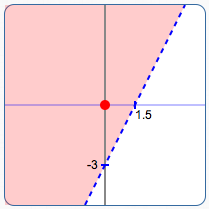
Since ‘$\,2(0) - 0 \lt 3\,$’ is true, shade the side containing the test point.
Special Linear Inequalities in Two Variables: You only see one variable
Out of context, sentences like ‘$\,x \ge 2\,$’ and ‘$\,y \lt 5\,$’ can be confusing. You only see one variable, but that doesn’t necessarily mean that there isn’t another variable with a zero coefficient!
Out of context, here are clues to what is likely wanted:
- ‘Solve: $\,x\ge 2\,$’ probably wants you to treat this as an inequality in one variable.
- ‘Graph: $\,x\ge 2\,$’ probably wants you to treat this as an inequality in two variables.
As shown below, there is a big difference in the nature of the solution set!
Viewed as an inequality in one variable, the solution set of ‘$\,x\ge 2\,$’ is the set of all numbers that are greater than or equal to $\,2\,.$ The solution set is the interval $\,[2,\infty)\,,$ shown below.
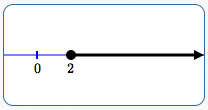 Graph of $\,x\ge 2\,,$
viewed as an inequality in one variable
Viewed as an inequality in two variables, ‘$\,x\ge 2\,$’ is really a shorthand for ‘$\,x + 0y \ge 2\,$’. The solution set is the set of all points $\,(x,y)\,,$ where the $x$-value is greater than or equal to $\,2\,.$ The $y$-value can be anything!
Here are examples of substitution into ‘$\,x + 0y \ge 2\,$’ :
- The point $\,(2,5)\,$ is in the solution set, since ‘$\,2 + 0(5) \ge 2\,$’ is true.
- The point $\,(3.5,-7.4)\,$ is in the solution set, since ‘$\,3.5 + 0(-7.4) \ge 2\,$’ is true.
The graph is the half-plane shown below. This is the picture of all the points with $x$-value greater than or equal to $\,2\,.$
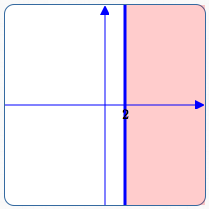 Graph of $\,x\ge 2\,,$
viewed as an inequality in two variables
Viewed as an inequality in two variables, ‘$\,y\lt 5\,$’ is really a shorthand for ‘$\,0x + y \lt 5\,$’. The solution set is the set of all points $\,(x,y)\,,$ where the $y$-value is less than $\,5\,.$ The $x$-value can be anything!
Here are examples of substitution into ‘$\,0x + y \lt 5\,$’ :
- The point $\,(2,4)\,$ is in the solution set, since ‘$\,0(2) + 4 \lt 5\,$’ is true.
- The point $\,(-7.4,-3)\,$ is in the solution set, since ‘$\,0(-7.4) -3 \lt 5\,$’ is true.
The graph is the half-plane shown below. This is the picture of all the points with $y$-value less than $\,5\,.$
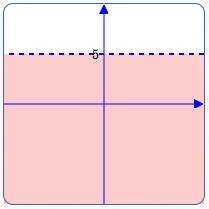 Graph of $\,y\lt 5\,,$
viewed as an inequality in two variables