 Mean, Median and Mode
You may want to review: Summation Notation
Statistics is the discipline devoted to organizing, summarizing, and drawing conclusions from data.
Given a collection of data, it is often convenient to come up with a single number that somehow describes its center; a number that in some way is representative of the entire collection. Such a number is called a measure of central tendency.
The two most popular measures of central tendency are the mean and the median. Another measure sometimes used to describe a ‘typical’ data value is the mode.
The Mean of a Data Set
The mean (or average) is already familiar to you: add up the numbers, and divide by how many there are:
or
$$ \begin{gather} \bar{x} \cssId{s21}{= \frac{\sum_{i=1}^n\ x_i}{n}}\cr \cssId{s22}{\text{(using summation notation)}} \end{gather} $$or
$$ \bar{x} \cssId{s23}{= \frac1n\sum_{i=1}^n\ x_i} $$(an alternative version of summation notation)
Thus, to find the mean of $\,n\,$ data values, you add them up and then divide by $\,n\,.$
Similarly, the mean of the $\,n\,$ data values $$\cssId{s27}{y_1,\ y_2,\ y_3,\ \ldots,\ y_n}$$ would be denoted by $\,\bar{y}\,$ and read as ‘$\,y\,$ bar’.
Since dividing by $\,n\,$ is the same as multiplying by $\,\frac{1}{n}\,,$ the notation $$\cssId{s33}{\frac{\sum_{i=1}^n\ x_i}{n}}$$ is more commonly written as: $$\cssId{s35}{\textstyle\frac 1n\sum_{i=1}^n\ x_i}$$ or $$\cssId{s36}{\frac 1n\sum_{i=1}^n\ x_i}$$
Example: Mean
Find the mean of these data values:
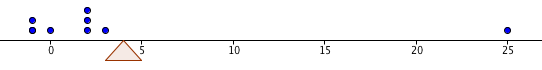
$$\cssId{s39}{2,\ -1,\ 2,\ 3,\ 0,\ 25,\ -1,\ 2}$$There are $\,8\,$ data values. The mean is found by adding them up and then dividing by $\,8\,$:
$$ \begin{align} &\cssId{s42}{\frac{2+(-1)+2+3+0+25+(-1)+2}{8}}\cr &\qquad \cssId{s43}{= \frac{32}{8}} \cssId{s44}{= 4} \end{align} $$ As discussed in Average of Three Signed Numbers, the mean gives the balancing point for the distribution, in the following sense: if eight pebbles of equal weight are placed on a ‘number line see-saw’ with- two pebbles at $\,-1$
- one pebble at $\,0$
- three pebbles at $\,2$
- one pebble at $\,3$
- and one pebble at $\,25$
then the support would have to be placed at $\,4\,$ for the see-saw to balance perfectly!
Notice in the previous example that the number $\,25\,$ seems to be unusually large, compared to the other numbers. An outlier is an unusually large or small observation in a data set.
A drawback of the mean is that its value can be greatly affected by the presence of even a single outlier. If the outlier $\,25\,$ is changed to $\,250\,,$ then the new mean would be $\,32.125\,,$ which does not seem at all representative of a ‘typical’ number in this data set!
The Median of a Data Set
The median, on the other hand, is quite insensitive to outliers.
Just as the median strip of a highway goes right down the middle, the median of a set of numbers goes right through the middle of the ordered list.
Of course, only lists with an odd number of values have a true middle: the middle number in the ordered list ‘$\,5,\ 7,\ 20\,$’ is $\,7\,.$ See how the definition below solves the problem when there are an even number of data values:
To find the median of a set of $\,n\,$ data values, first order the observations from least to greatest (or greatest to least).
If $\,n\,$ is odd, then the median is the number in the exact middle of the ordered list. That is, the median is the data value in position $\,\frac{n+1}{2}\,$ of the ordered list.
If $\,n\,$ is even, then the median is the average of the two middle members of the ordered list. That is, the median is the average of the data values in positions $\,\frac{n}{2}\,$ and $\,\frac{n}{2}+1\,$ of the ordered list.
Example: Median
There are an even number of values, so we average the values in positions four and five: the median is $\,\frac{2+2}{2} = 2\,.$
Note that, for this data set, the median seems to do a better job than the mean in representing a ‘typical’ member. Note also that if the outlier $\,25\,$ is changed to $\,250\,,$ it doesn't affect the median at all!
The Mode of a Data Set
Finally, a mode is a value that occurs ‘most often’ in a data set. Whereas a data set has exactly one mean and median, it can have one or more modes.
Examples: Mode
For example, consider these data values:
$$ \cssId{s100}{2,\ -1,\ 2,\ 3,\ 0,\ 25,\ -1,\ 2} $$Re-group them occurring to their frequency:
$$ \begin{align} \cssId{s102}{2,\ \ 2,\ \ 2}\quad &\cssId{s103}{\text{(three occurrences of the number 2)}}\\ \cssId{s104}{-1,\ \ -1}\quad &\cssId{s105}{\text{(two occurrences of the number -1)}}\\ \cssId{s106}{0}\quad &\cssId{s107}{\text{(one occurrence of the number 0)}}\\ \cssId{s108}{3}\quad &\cssId{s109}{\text{(one occurrence of the number 3)}}\\ \cssId{s110}{25}\quad &\cssId{s111}{\text{(one occurrence of the number 25)}} \end{align} $$The mode of this data set is $\,2\,,$ since this data value occurs three times, and this is the most occurrences of any data value.
Every member of the data set ‘$\,3,\ 7,\ 9\,$’ is a mode, since each value occurs only once.
The data set ‘$\,3,\ 3,\ 7,\ 7,\ 9\,$’ has two modes: $\,3\,$ and $\,7\,.$ Each of these numbers occurs twice, and no number occurs more than two times.