 Linear Inequalities in Two Variables (Part 2)
(This page is Part 2. Click here for Part 1.)
The Test Point Method for Graphing Linear Inequalities in Two Variables
So, what about graphing something like $\,2x - y \lt 3\,,$ which isn't in slope-intercept form? You can (if desired) solve for $\,y\,,$ and then use the method above: $$\begin{gather} \cssId{s3}{2x - y \lt 3}\cr \cssId{s4}{-y \lt -2x + 3}\cr \cssId{s5}{y \gt 2x - 3} \end{gather} $$ (Remember to change the direction of the inequality symbol when you multiply/divide by a negative number.)
The graph of $\,2x - y \lt 3\,$ is the same as the graph of $\,y \gt 2x - 3\,.$ Graph the line $\,y = 2x - 3\,$ (dashed), and then shade everything above (see below). However, there's an easier way. Keep reading!
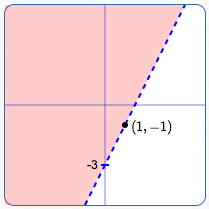 Graph of $\,2x - y \lt 3\,$
(which is equivalent to
$\,y > 2x - 3\,$)
The ‘Test Point Method’ is so-called because it involves choosing a ‘test point’ to decide which side of the line to shade. The process is illustrated with an example: graphing $\,2x - y \lt 3\,.$ The Test Point Method is usually easiest to use with sentences that aren't in slope-intercept form.
Graph, Using the Test Point Method: $\,2x - y \lt 3$
Step 1: Identification
Recognize that ‘$\,2x - y \lt 3\,$’ is a linear inequality in two variables. Therefore, you know the graph is a half-plane. You need the boundary line; you need to know which side to shade.
Step 2: Boundary Line
Graph the boundary line $\,2x - y = 3\,$ using the intercept method:
- when $\,x = 0\,,$ $\,y = -3\,$
- when $\,y = 0\,,$ $\,x = \frac{3}{2}\,$
Since the verb in ‘$\,2x - y \lt 3\,$’ is ‘$\,<\,$’, this line is not included in the solution set. Therefore, the line is dashed.
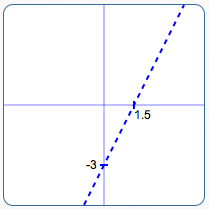 Graph the boundary line
using the intercept method
Step 3: Test Point to Decide Which Side to Shade
Choose a simple point that is not on the line. Whenever $\,(0,0)\,$ is available, choose it! Zeroes are very easy to work with.
Is $\,(0,0)\,$ in the solution set? Substitute $\,x = 0\,$ and $\,y = 0\,$ into the original sentence ($\,2x - y \lt 3\,$), to see if it is true or false. Put a question mark over the inequality symbol, since you're asking a question:
$$ \cssId{s37}{2(0) - 0 \overset{?}{\lt} 3} $$If the result is true, shade the side containing the test point. If the result is false, shade the other side.
Since ‘$\,0 < 3\,$’ is true, shade the side containing $\,(0,0)\,.$ Done!
With so many zeroes involved in this method, computations can often be done in your head, making this quick and easy!
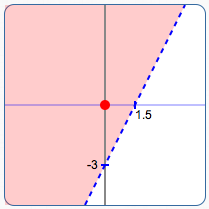
Since ‘$\,2(0) - 0 \lt 3\,$’ is true, shade the side containing the test point.
Special Linear Inequalities in Two Variables: You only see one variable
Out of context, sentences like ‘$\,x \ge 2\,$’ and ‘$\,y \lt 5\,$’ can be confusing. You only see one variable, but that doesn't necessarily mean that there isn't another variable with a zero coefficient!
Out of context, here are clues to what is likely wanted:
- ‘Solve: $\,x\ge 2\,$’ probably wants you to treat this as an inequality in one variable.
- ‘Graph: $\,x\ge 2\,$’ probably wants you to treat this as an inequality in two variables.
As shown below, there is a big difference in the nature of the solution set!
Viewed as an inequality in one variable, the solution set of ‘$\,x\ge 2\,$’ is the set of all numbers that are greater than or equal to $\,2\,.$ The solution set is the interval $\,[2,\infty)\,,$ shown below.
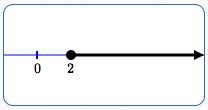 Graph of $\,x\ge 2\,,$
viewed as an inequality in one variable
Viewed as an inequality in two variables, ‘$\,x\ge 2\,$’ is really a shorthand for ‘$\,x + 0y \ge 2\,$’. The solution set is the set of all points $\,(x,y)\,,$ where the $x$-value is greater than or equal to $\,2\,.$ The $y$-value can be anything!
Here are examples of substitution into ‘$\,x + 0y \ge 2\,$’ :
- The point $\,(2,5)\,$ is in the solution set, since ‘$\,2 + 0(5) \ge 2\,$’ is true.
- The point $\,(3.5,-7.4)\,$ is in the solution set, since ‘$\,3.5 + 0(-7.4) \ge 2\,$’ is true.
The graph is the half-plane shown below. This is the picture of all the points with $x$-value greater than or equal to $\,2\,.$
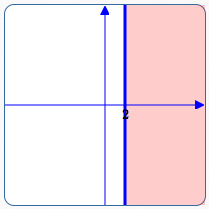 Graph of $\,x\ge 2\,,$
viewed as an inequality in two variables
Viewed as an inequality in two variables, ‘$\,y\lt 5\,$’ is really a shorthand for ‘$\,0x + y \lt 5\,$’. The solution set is the set of all points $\,(x,y)\,,$ where the $y$-value is less than $\,5\,.$ The $x$-value can be anything!
Here are examples of substitution into ‘$\,0x + y \lt 5\,$’ :
- The point $\,(2,4)\,$ is in the solution set, since ‘$\,0(2) + 4 \lt 5\,$’ is true.
- The point $\,(-7.4,-3)\,$ is in the solution set, since ‘$\,0(-7.4) -3 \lt 5\,$’ is true.
The graph is the half-plane shown below. This is the picture of all the points with $y$-value less than $\,5\,.$
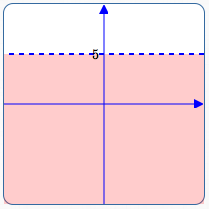 Graph of $\,y\lt 5\,,$
viewed as an inequality in two variables